Wenzhou Zungwan - Packaging Machinery Equipment Manufacturers

- All
- Product Name
- Product Keyword
- Product Model
- Product Summary
- Product Description
- Multi Field Search


Views: 0 Author: Site Editor Publish Time: 2026-05-27 Origin: Site


Purchasing a packaging system purely based on standard spec sheets often creates catastrophic operational bottlenecks. Buyers frequently miscalculate actual throughput limits in their facilities. Overestimating capacity easily results in missed delivery commitments, delayed shipments, and furious clients. Conversely, over-capitalizing on unnecessary speed heavily destroys your potential return on investment. The financial damage of buying too much machine is severe.
You cannot rely on raw equipment speed ratings alone to guarantee high output. True line capacity demands calculating exact cycle times against physical product variables. You must factor in changeover delays, maintenance windows, and downstream equipment limits. A single slow machine slows down everything.
This article gives operations managers and technical buyers a reliable mathematical framework. We provide the exact evidence-based tools you need to calculate real production limits. You will learn to properly evaluate equipment without falling for exaggerated performance claims. Master these formulas, and you will secure a highly efficient production floor.
Target packaging speed must account for a standard 20% redundancy buffer to accommodate realistic downtime, cleaning, and shift changes.
Evaluating a "bottles per minute filling machine" requires factoring in three constraints: liquid viscosity, exact container volume, and automation level.
System capacity is always dictated by the slowest node; single-machine efficiency (OEE) matters less than Overall Line Efficiency (OLE).
Planning for an 85% capacity utilization rate is the industry-standard "sweet spot" to avoid accelerated machine wear and maintain surge flexibility.
Buyers constantly ask manufacturers for a flat "bottles per minute" (BPM) rating. They rarely define their operational parameters first. This simplistic approach guarantees failure. Evaluating a bottles per minute filling machine requires factoring in three vital physical constraints. Without defining these elements, any BPM number remains purely fictional.
First, consider liquid physics. Viscosity heavily influences flow rates. Water-thin liquids flow rapidly through nozzles. High-viscosity gels flow slowly. Foaming liquids create unique mechanical challenges. They require bottom-up filling techniques. Plunging nozzles must rise slowly to prevent overflow. Foaming actively caps your maximum physical speed. You cannot push a sudsy product at high velocities without creating massive spills.
Second, calculate container volume differences. Cycle times vary greatly based on container size. A four-head filler processes 16-ounce bottles much faster than 1-gallon jugs. The fill time itself increases exponentially. Bottle neck size also impacts speed. Narrow necks restrict fluid entry rates. You must demand BPM claims explicitly state the exact container volume tested. Never accept a generalized performance number.
Third, look at automation dependencies. Semi-automatic systems suffer heavily from operator fatigue. Manual indexing remains highly inconsistent over an eight-hour shift. Fully automatic systems use quantifiable indexing. Conveyors and PLC controls guarantee steady outputs. You can mathematically predict fully automated cycle times.
Production Variable | Impact on Packaging Speed | Mitigation Strategy |
|---|---|---|
Liquid Viscosity | High viscosity slows fluid dynamics, increasing the required nozzle open time per cycle. | Use heated hoppers to thin gels or utilize positive displacement piston systems. |
Container Volume | Larger volumes exponentially increase individual cycle times regardless of automation. | Calculate strict unit-per-minute metrics based entirely on your largest SKU. |
Automation Level | Manual intervention introduces erratic cycle times and inevitable end-of-shift fatigue. | Upgrade to fully automated PLC conveyors for mathematical predictability. |
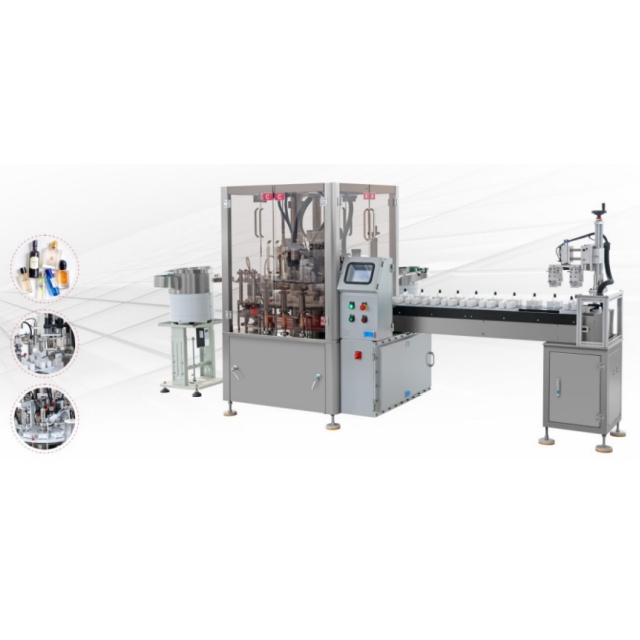
Provide actionable math to your procurement team. Sizing a bottles per minute filling machine requires understanding actual facility constraints. We use two primary methods to determine target speed accurately. Choose the method matching your production style.
Use this approach when processing continuous upstream production. Your packaging line speed must strictly exceed the maximum upstream continuous output. If your mixing tanks yield 500 liters hourly, your filler must process more than 500 liters hourly. You cannot risk a bottleneck here.
Apply the 20% Buffer Rule. Multiply your theoretical target speed by a 0.8 efficiency coefficient. This math guarantees 20% redundancy. Redundancy covers Clean-in-Place (CIP) cycles, daily maintenance, and unavoidable micro-stops. If you need 100 bottles per minute continuously, you must purchase a machine rated for 125 bottles per minute.
Identify the maximum continuous yield from upstream processing tanks.
Convert this yield into units per minute based on specific container volume.
Divide the target unit rate by 0.8 to establish the required machine rating.
Use this logic for batch processing. It works perfectly for matching customer demand directly. You must calculate Takt Time. Takt Time equals available working hours divided by customer demand. This gives you the rhythmic heartbeat your facility needs to maintain.
Work backwards from your monthly quotas. Map out your exact shift schedules. Exclude scheduled breaks, maintenance windows, and national holidays. This reveals the minimum necessary cycle time per bottle. If customers demand 10,000 units weekly, and you operate 40 hours weekly, your Takt Time calculations dictate exactly how fast your machines must run.
Anchor your purchasing decisions in financial reality. You must critically evaluate manufacturer claims. Many buyers struggle to differentiate between theoretical numbers and daily operational truths. Confusing these two metrics ruins business plans quickly.
Manufacturers advertise Nameplate Capacity heavily. Think of this as the theoretical maximum speed. Engineers achieve this number under perfect, uninterrupted laboratory conditions. They test water-thin liquids. They use perfectly molded, flawless bottles. Do not base your financial ROI on this metric. It rarely translates to the unpredictable factory floor.
Demonstrated Capacity represents your real financial reality. It measures historical, real-world output over weeks or months. This calculation inherently includes non-value-added time. It accounts for operator inefficiencies. It factors in raw material variances. Always build your business case using Demonstrated Capacity.
Running any mechanical system at 100% capacity creates massive operational risk. It accelerates machine wear dramatically. It guarantees overheating and frequent mechanical breakdowns. Industry standards highlight 85% as the ideal target utilization rate. This sweet spot balances high throughput and long machine lifespan. It also leaves crucial flexibility for unexpected surge orders. If a large client demands a rush shipment, you have a 15% buffer ready to deploy.
Metric Category | Definition | Business Application |
|---|---|---|
Nameplate Capacity | Theoretical maximum speed achieved under sterile laboratory conditions. | Used solely to gauge raw engineering potential; useless for daily forecasting. |
Demonstrated Capacity | Real-world historical output including downtime, breaks, and material flaws. | Used directly for calculating financial ROI, lead times, and scheduling. |
Optimal Utilization | Operating the machinery consistently at 85% of its demonstrated maximum limit. | Preserves equipment lifespan while maintaining emergency order surge flexibility. |
A high-speed filler remains useless if downstream equipment fails to keep pace. You must view the entire system holistically. Ignoring downstream constraints completely nullifies your upfront machinery investment.
Constraint theory teaches us a vital lesson. The total capacity of any packaging line strictly equals its slowest component. Buying a 200-bottle-per-minute filler wastes money if your labeler peaks at 100 bottles per minute. Your actual output will never exceed 100 bottles. You will simply create a massive backlog between the two machines.
Your capper and labeler must synchronize perfectly. Every node must run at the exact same rhythmic pace. Mismatched capping speeds easily cause container backlogs. Sudden stops cause liquid overflow on the conveyor belt. Spills require manual cleanup. This drastically increases your non-planned downtime.
Consider these synchronization best practices:
Calibrate conveyors to maintain equal physical spacing between containers.
Utilize central PLC networking to automatically govern multi-machine speeds.
Install rotary accumulation tables before the slowest machine node to act as physical buffers.
Implement automated rejection systems to remove defective bottles without halting the line.
Shift your evaluation criteria immediately. Move away from Overall Equipment Effectiveness (OEE). OEE focuses too heavily on single machines isolated from the whole. Adopt Overall Line Efficiency (OLE). OLE provides a systemic focus across the entire floor.
Packaging material tolerances frequently cause hidden speed degradation. Bad carton blanks jam packers. Inconsistent film thickness causes poor thermal seals. Poorly threaded caps cause sensor faults. OLE exposes these hidden faults across the entire line, proving speed issues often stem from materials rather than mechanics.
Tie technical calculations directly to financial outcomes. Smart procurement looks beyond the immediate fiscal quarter. You must strategically forecast machinery capability against anticipated sales growth.
We strongly recommend purchasing equipment rated for projected three-to-five-year growth. Buying exactly for today's volume leads to premature obsolescence. Your business will outgrow the machine too quickly. You will soon face mandatory overtime shifts. Conversely, buying for ten years out destroys current capital efficiency. It ties up vital cash flow in unused iron.
You must evaluate hidden operational costs rigorously. Changeover times frequently destroy profit margins. Evaluate how quickly operators can switch between multiple SKUs. Look for SMED (Single-Minute Exchange of Die) applicability. Machines featuring toolless changeovers and quick-release clamps save hundreds of hours annually.
Investigate replacement costs for proprietary specialty parts. Some vendors lock you into expensive, exclusive maintenance ecosystems. Custom-machined nozzles or specialized sensors drain maintenance budgets fast. Avoid these traps. Demand equipment utilizing universally available pneumatic and electrical components.
Shortlist equipment designed for modular upgrades. Many systems allow you to add fill heads later. You might start with four heads to match a tight budget. Next year, you bolt on four more heads to double capacity. This elegantly bridges the gap between current budget constraints and future speed requirements. Modularity rigorously protects your initial capital investment.
Successful procurement heavily relies on calculating Demonstrated Capacity accurately. You must ensure rigorous downstream synchronization across your entire packaging floor. Stop relying on standard spec sheets. Start applying rigorous physical math to your liquid types and container volumes. Do not let optimistic marketing numbers dictate your operational planning.
We strongly advise conducting a comprehensive Line Efficiency Audit immediately. Use Time Observation Sheets to track exact cycle speeds. Implement Operator Balance Charts on your current setup. Perform these audits long before requesting vendor quotes. Knowing your exact constraints prevents expensive miscalculations.
Finally, consult directly with a systems engineer. They will help match your exact liquid and container profiles to verified machine capabilities. Expert guidance ensures you buy the exact capacity you need to scale profitably.
A: You must use a weighted capacity calculation. Multiply the quantity of Product A by its exact cycle time. Do the same for Product B. Add these totals together. Crucially, you must also add the required changeover times between runs. This provides a realistic total machine-hour requirement for your mixed schedule.
A: Machine-hour capacity defines your total available working time across a given shift or week. It represents your theoretical production window. Cycle time measures the exact number of seconds required to complete one finished unit. You divide total machine-hours by cycle time to calculate your maximum unit output.
A: Implement Lean Manufacturing strategies immediately. Use Total Productive Maintenance (TPM) to reduce unexpected downtime. Optimize your operator workstation layout to minimize wasted physical movement. Most importantly, focus on reducing changeover times using SMED principles. Faster changeovers directly unlock hidden production capacity within your existing work shifts.


